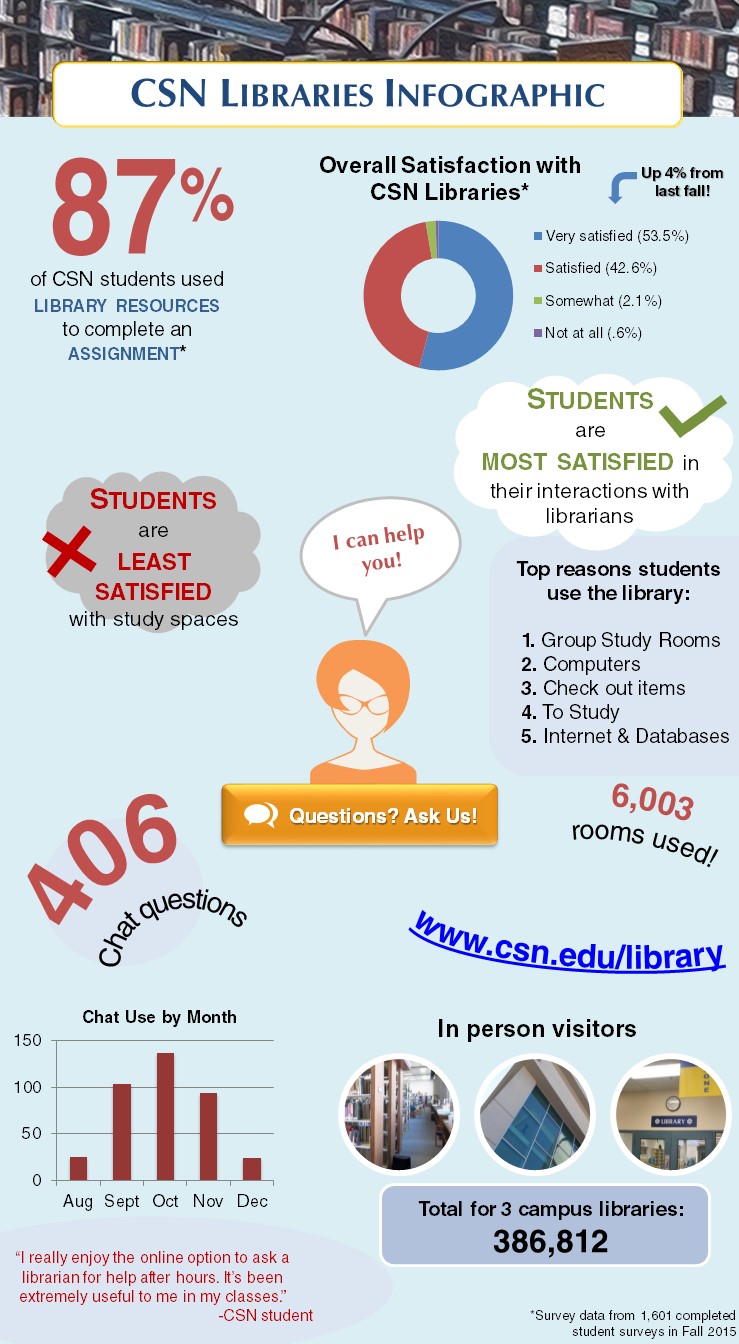
You may have seen online images filled with facts that analyze anything from water conservation to Disney princesses. Infographics are exactly what they sound like: a combination of information and graphics. They’re a way to share data more visually, and typically look like one long page of charts, icons, pictures, and text. If your professor allows for a creative research assignment, you might consider making your own!
Step 1: Organize Your Research
Before you can put them into picture form, you have to know what facts you want to use on your infogrpahic. Visit a CSN library, in person or online, to gather sources (the same as with a research paper) and then make your choices. Consider displaying:
- The most important information you’ve learned
- Data that makes the most emotional impact (it’s impressive or shocking)
- Facts that are easy to show through graphs, pie charts, or icons
Step 2: Choose a Method for Creation
Many programs exist for creating infographics online. Most just require an email address to sign up for the free version. If this is your first time making an infographic, check out:
- Canva – Easy to use for all kinds of graphics, just be careful to select the free clipart
- Piktochart – 600 professionally-designed templates, just for infographics
- PowerPoint – Change the size of a single slide to make it longer under the “Design” tab (Don’t have PowerPoint? Download it for free through your CSN student email account. Ask a librarian how!)
Step 3: Design
Unlike a research paper, Infographics can have data all over the place—not just in a linear order—as long as the page isn’t too distracting. Consider breaking up your page into different sections that each represent a finding of your research. Use a main heading as the title at the top and subheadings to explain each data point. Keep text short and let the images do the talking! It’s also helpful to view other infographics and templates for inspiration.

Step 4: Share it!
Infographic software usually has the option to download your work as a JPEG or PDF file when finished. Once the file is saved, just post it to any blog or website you have access to, email it to your professor, or upload it into Canvas where the assignment is due.
With full creativity and freedom of design, an infographic for class can be more fun than you realized!

